Could a clean-looking peptide HPLC trace tell you less than its purity figure suggests? When you’re interpreting a peptide HPLC chromatogram, a prominent main peak and a high area percentage can seem conclusive. But the figure reflects the relative signal from detected compounds under a particular method. It doesn’t, by itself, confirm the peptide’s identity or account for everything in the sample.
Retention times, peak labels and area percentages are useful when read in context. Column chemistry, mobile phase and gradient can all change how a trace appears, so results from different methods may not be directly comparable. This guide explains how to read the axes, baseline, peaks and retention times, then assess what area-percentage purity can and can’t tell you. It also covers features that may not indicate an impurity and provides a consistent checklist for reviewing the method alongside the result.
Key Takeaways
- Start with the method notes, then read the axes and baseline before drawing conclusions from the peaks.
- When interpreting a peptide HPLC chromatogram, treat the peak apex as an observed retention time, not proof of identity.
- Use area percentage to understand the relative detector response under that method, not the sample’s total composition.
- Compare chromatograms cautiously: column chemistry, gradient and other conditions can affect peak appearance and retention time.
- Review integration and possible artefacts, then record what the trace supports and what remains unestablished.
What a peptide HPLC chromatogram shows, and what it cannot show
A chromatogram records detector response as separated components elute over time. In peptide analysis, it is a visual record of signals produced under a particular set of conditions. It can help you assess when detected components appear and how their signals compare, but it isn’t a complete inventory of everything in the sample.
The x-axis shows time, often expressed as retention time, while the y-axis shows detector response. The method behind the trace matters: High-performance liquid chromatography (HPLC) separates components through their interactions with a column and mobile phase. The detector then records a response as components pass through it. Read the trace alongside the method, detector, integration settings and peak assignments.
A visible peak is evidence of a detected signal, not automatic proof that a particular peptide is present. A component may produce little or no response with the detector used, overlap with another component, or be obscured by baseline noise. A peak may also be a signal that needs investigation rather than a confirmed impurity. The trace shows what the method detected and resolved, not necessarily every constituent in the sample.
As a first pass, separate observations from interpretations:
- Observation: a peak appears at a recorded retention time.
- Interpretation: the peak is assigned to a particular compound based on supporting evidence.
This distinction is central to interpreting a peptide HPLC chromatogram. The trace is an analytical result, but its meaning depends on how it was produced and how its peaks were evaluated.
Read the axes before interpreting the peaks
Retention time is the time associated with a component eluting from the column, usually measured from injection to the observed peak. It can help compare results produced using the same method, but it isn’t a universal identifier. The y-axis records detector response, which depends on the detector configuration and analytical conditions. Peak height describes the signal’s maximum; peak area reflects the signal integrated across the peak. They are not interchangeable measures.
For example, a narrow peak may be tall but have less area than a broader, shorter peak. Detector settings, including the selected wavelength for UV detection, also affect the displayed response. Read the axis labels and units first, then note the detector and method conditions before comparing signal size or retention times.
Separate an observation from a conclusion
A peak apex gives an observed retention time, not definitive chemical identity. Assignment requires supporting evidence, such as comparison with a suitable reference or confirmation by an orthogonal technique. Likewise, a trace without a distinct extra peak doesn’t establish that no other components are present. Undetected signals and unresolved compounds may not appear as separate peaks.
Keep the conclusion proportional to the evidence: A chromatographic peak is an observed detector signal, not a confirmed chemical identity. This describes what the trace directly supports while leaving identity claims to evidence that can establish them.
How to read the main peak, retention time, and baseline
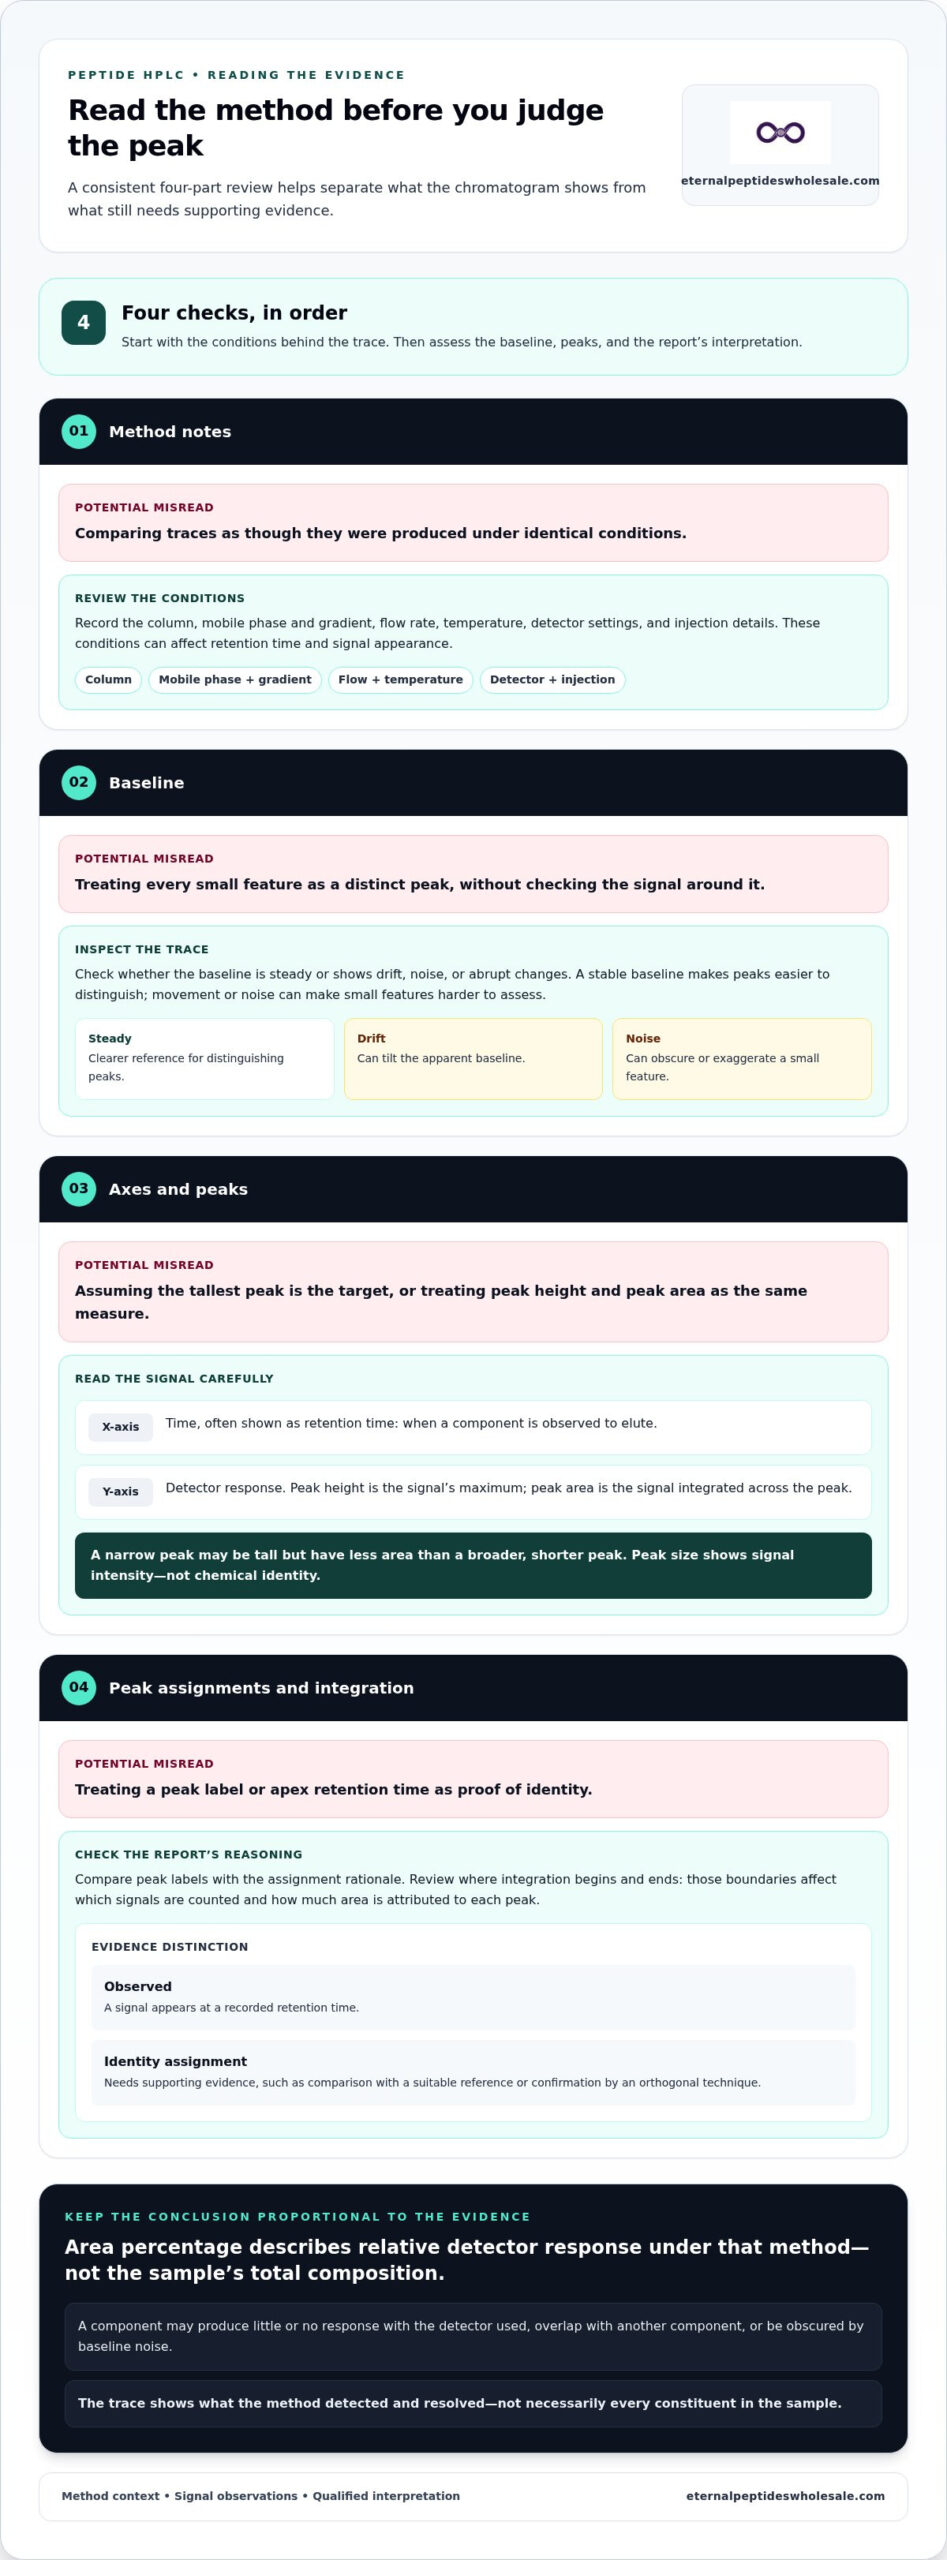
Use a consistent sequence rather than starting with the tallest feature. The method notes establish the conditions behind the trace, the baseline helps you judge whether a signal is distinct, and peak assignments and integration show how the report has interpreted those signals. This order makes it easier to identify where the evidence is clear and where interpretation needs qualification.
- Review the method notes. Record the column, mobile phase and gradient, flow rate, temperature, detector settings and injection details. These conditions affect retention time and signal appearance, so they are essential context for interpreting a peptide HPLC chromatogram.
- Inspect the baseline. Check whether it remains steady across the run or shows drift, noise or abrupt changes. A stable baseline makes peaks easier to distinguish; movement or noise can make small features harder to assess.
- Locate the peaks. Note each peak’s position, shape and relative size. The apex indicates the observed retention time, while the integrated area depends on how the signal is bounded and calculated.
- Check assignments and integration. Compare peak labels with the report’s assignment rationale, and review where integration begins and ends. These choices affect which signals are counted and how much area is attributed to each peak.
Assess the assigned main peak and retention time
Look for how the report identifies the proposed target peak and whether it describes evidence for that assignment. Retention time is useful for comparison when analytical conditions are comparable, but it isn’t an identity test on its own. If the column, gradient or other settings differ, a change in retention time may reflect the method rather than a different compound.
Don’t assume the largest peak is the target: peak size shows signal intensity, not chemical identity. A prominent peak may be consistent with the proposed assignment, but its size alone cannot establish what produced it.
Check the baseline and integration boundaries
A steady baseline provides a clearer reference for distinguishing a peak from background response. Drift can tilt the apparent baseline, while noise can make a small feature look more pronounced or obscure it. Inspect the trace around each minor peak, not just the main signal, and note whether a baseline change occurs near the feature.
Integration boundaries determine which part of the detector response is included in a peak’s area. If boundaries differ between reports, the calculated area can differ too, even when traces look broadly similar. Treat small signals close to baseline movement or noise cautiously, and don’t label them impurities based on appearance alone.
For laboratory research procurement, wholesale research peptides from Eternal Peptides Wholesale are supplied for laboratory research purposes. Keep procurement decisions separate from trace interpretation: a chromatogram can inform an assessment, but conclusions should remain limited to what the method and report support.
What peptide HPLC area percentage means for purity
Area percentage describes the share of integrated detector response attributed to a peak, relative to the peaks included in the calculation. If a report assigns one peak to the target, its area is compared with the total integrated area included in the calculation. The result describes the measured signal profile under that method; it is not a direct measurement of every substance in the sample.
Compounds can produce different detector responses. A component that absorbs strongly at the selected wavelength may contribute more signal than an equal amount of a component that absorbs weakly. Integration choices matter too: excluding a peak, setting different boundaries or handling the baseline differently can change the reported percentage. Read the calculation basis and integration rules before comparing figures.
An HPLC area-percentage result is specific to the method and detector; it isn’t a universal measure of sample mass. Don’t convert it into a mass or molar percentage unless validated evidence supports that conversion.
Area percentage versus sample mass
Area normalisation typically expresses an assigned peak’s integrated area as a proportion of the total area counted in the calculation. The denominator matters. If some signals are excluded, unresolved or not detected, they won’t contribute to that total. Two reports can therefore show different percentages because of their integration approach, even before differences in method conditions are considered.
For practical interpretation, note which peaks were included, whether any were excluded, and how the baseline was integrated. A percentage without this context can give a false sense of comparability. When interpreting a peptide HPLC chromatogram, treat the figure as a measure of relative detector response under the stated method, not a stand-alone mass balance.
Purity, identity, and net peptide content answer different questions
These terms describe separate types of evidence. Use the comparison below to keep their meanings distinct when reviewing a report.
| Measure | What it indicates | What it doesn’t establish alone |
|---|---|---|
| Area percentage | The assigned peak’s share of the integrated detector response included under a defined method. | The target’s identity or its percentage of total sample mass. |
| Identity evidence | Whether the proposed compound assignment is supported by suitable analytical evidence, such as orthogonal analysis. | The sample’s total peptide content or overall composition. |
| Net peptide content | The amount of peptide relative to the total material, assessed using an appropriate content measurement. | The relative profile of detected chromatographic peaks by itself. |
A high area percentage may indicate that one detected signal dominates the integrated profile. It doesn’t tell you how much of the total powder mass is peptide, nor does it confirm the peak’s identity. Net content can be affected by material that the chromatographic area calculation doesn’t measure as a peptide peak, such as water or counter-ions. Keep each conclusion tied to the evidence designed to answer that specific question.
How method conditions and artefacts change a peptide chromatogram
A chromatogram’s appearance depends on more than the sample. Column chemistry, gradient, flow rate, temperature and detector settings all influence how components separate and how their signals appear. Injection volume, sample preparation and the injection solvent can also affect peak shape. As a result, two traces may look different even if they come from the same material.
Before comparing separate reports, use this checklist to establish whether the methods are sufficiently alike:
- Column: compare the stationary-phase chemistry, dimensions and particle characteristics where reported.
- Elution conditions: check the mobile phase, gradient programme and flow rate.
- Temperature: note the column temperature, as it can affect separation and retention.
- Detection: compare detector type and wavelength; different settings can alter the recorded response.
- Injection and preparation: review the sample solvent, preparation and injection conditions.
If these details differ, retention time and peak shape may shift for method-related reasons. Treat traces produced by different methods as separate analytical contexts, not interchangeable measurements. Matching retention times alone doesn’t make two chromatograms comparable.
Compare method notes before comparing traces
Start with the column chemistry and dimensions, then compare the gradient, flow rate, temperature and detector wavelength. Check sample preparation and injection details as well. If a report omits a parameter, record that gap rather than assuming it matches another run. This method-first check helps distinguish a difference in the observed profile from one that may reflect changed analytical conditions.
Recognise peak-shape issues without overdiagnosing
Tailing is a peak with an extended slope after its apex; fronting is an asymmetry that extends before it. Broadening describes a peak spread over more time, while co-elution occurs when components overlap rather than separating into distinct peaks. Each can complicate assessment, but shape alone doesn’t identify the cause.
Some features may be associated with the sample, while others may arise from the analytical system, solvent or injection conditions. Baseline drift and noise can also obscure smaller signals or make them appear more prominent. A solvent-front feature or a signal appearing unexpectedly in a run may warrant review, but its appearance alone doesn’t establish whether it belongs to the sample. Avoid labelling a feature as an impurity or a system artefact without supporting evidence.
For unresolved findings, review the method documentation and seek qualified analytical review. When interpreting a peptide HPLC chromatogram, describe what is visible, note the method context and keep any proposed cause separate from the observation. This supports more reliable comparisons without overstating what a trace proves.
For laboratory research procurement, explore wholesale research peptides from an Australian-based supplier. A chromatogram remains one part of an assessment, not a stand-alone validation of a material.
A practical checklist for reviewing peptide HPLC documentation
A repeatable review helps keep observations separate from assumptions. Work through the method first, then the trace and its calculations, and finally state what the evidence can support. This approach makes it easier to review reports consistently, including when documents differ in detail or presentation.
Use a repeatable chromatogram review checklist
- Identify the method. Record the separation approach, column details, mobile phase or gradient, flow rate, temperature and detector conditions where reported. Note missing details rather than assuming they match another analysis.
- Inspect the trace. Check the axes, baseline and visible peaks. Note whether the baseline is stable, whether signals are resolved, and whether noise or unusual peak shape could affect interpretation.
- Assess assignments and integration. Review how the proposed target peak is labelled and whether the report describes supporting assignment evidence. Check integration boundaries, included peaks and any excluded signals, as these can affect reported area percentages.
- Qualify the conclusion. Separate direct observations from claims about identity, chromatographic purity or total sample composition. State which conclusions the method supports and which remain unestablished.
For example, a review note might record that a dominant signal appears at a stated retention time and accounts for a reported proportion of the included detector response. It should not extend that observation into a claim about confirmed identity or total peptide content unless other evidence supports it. This distinction is central to interpreting a peptide HPLC chromatogram.
Reports vary in the information they provide. A missing method parameter doesn’t automatically invalidate a trace, but it limits how confidently you can compare that trace with another result. Preserve the report’s own terms and note the boundaries of your interpretation.
Apply the interpretation in research procurement
Analytical documentation is one part of a broader review of research materials. Read it alongside other available material-specific information, and keep conclusions tied to evidence for that particular sample or batch. A chromatogram alone doesn’t verify a product or establish every aspect of its composition.
For a wider procurement framework, see Quality Assurance in Research Peptides: A Wholesale Procurement Guide. The same evidence-led approach applies: assess what the documents show, identify what they don’t establish, and avoid treating a single analytical result as a complete quality determination.
Use these notes to support clear, consistent research procurement decisions, not to overstate what a trace proves. Explore research-grade peptides for laboratory use through an Australian-based wholesale supplier serving research customers nationally.
Carry a clearer evidence standard into your next decision
Use your review notes to set a practical boundary for each result: what the documentation supports, what requires further evidence, and what should remain an open question. That boundary helps research teams apply consistent judgement when reviewing analytical records and planning procurement. Interpreting a peptide HPLC chromatogram is most useful when it informs a wider evidence-based decision rather than standing in for one.
For research materials, consider the supplier’s purpose and scope alongside the documentation. Eternal Peptides Wholesale is an Australian-based wholesale supplier of research-grade peptides for laboratory research purposes only. Its products are not for human consumption or medical use, and a chromatogram alone shouldn’t be treated as product verification.
Explore wholesale research-grade peptides for laboratory use from Eternal Peptides Wholesale.
Frequently Asked Questions
What do the x-axis and y-axis show on a peptide HPLC chromatogram?
The x-axis shows elapsed time, often labelled as retention time, and the y-axis shows the detector’s response. A peak positioned later along the x-axis eluted later in that run, while its vertical height reflects the recorded signal at its apex. Axis labels and units can vary between reports, so check them before comparing traces or interpreting a displayed value.
Does a higher chromatogram peak mean there is more peptide in the sample?
Not necessarily. Peak height is the maximum detector response, and a tall, narrow peak may have a different integrated area from a shorter, broader one. Signal size also depends on detector settings, the compound’s response and the amount injected. A higher peak doesn’t, on its own, establish that the sample contains more peptide. When interpreting a peptide HPLC chromatogram, distinguish peak height from measured quantity.
Can an HPLC chromatogram confirm a peptide’s identity?
No, a chromatogram alone generally can’t confirm chemical identity. Retention time or comparison with a reference can support a proposed assignment, but another compound may produce a signal in a similar position. Identity is more robustly assessed using suitable supporting evidence, such as mass spectrometry, which provides information about molecular mass. The evidence needed depends on the analytical question and the method used.
Why might the same peptide have different retention times in two HPLC runs?
Retention time can shift if the runs use different columns, mobile phases, gradient programmes, flow rates or temperatures. Sample preparation and injection conditions may also affect the observed result. A report using different column chemistry, for example, isn’t directly comparable just because the sample is described as the same peptide. Check the method details first, then interpret any difference in context.
What does a flat baseline between peaks indicate?
A flat baseline indicates that the detector response appears relatively steady in that interval, with no distinct signal resolved above it under the conditions used. It doesn’t prove that the interval contains no compounds. A component might produce a weak response, overlap with another signal or remain below the method’s detection capability. Consider the detector, scale and trace quality before treating a flat section as evidence of absence.
Can a peptide impurity be missed in an HPLC chromatogram?
Yes. An impurity may be difficult to see if it produces a weak detector response, co-elutes with the main component or appears close to background noise. Sample preparation and method conditions can also affect whether signals are resolved. A trace therefore describes what that analysis detected, not every possible component. If a specific impurity matters to the research question, consider the method’s suitability and detection capability.
What information should accompany an HPLC chromatogram?
A useful report should identify the method and detector conditions, including the column, mobile phase or gradient, flow rate, temperature and detection wavelength where applicable. It should also show the trace with labelled axes, peak assignments, retention times and integration results. Sample identification and preparation details help put the run in context. For comparisons, include the corresponding information for each analysis so differences can be assessed fairly.
Related from Eternal Peptides Wholesale
Eternal Peptides Wholesale publishes batch-specific Janoshik Analytical reports in its certificate of analysis library, so the documentation for a listed batch can be read alongside the evidence discussed in this article.
- Peptide COA library: batch-specific Janoshik Analytical reports with their verification details
- Our peptide testing standards: how independent Janoshik testing is used and reported
- Janoshik reports explained: what each test measures and its limits
- Evidence review: Synthetic peptides: manufacture, impurities and analytical verification
- Evidence review: What are peptides used for? Synthetic peptides as research tools